Settings
User settings
admin_id = "ITF2"
workdir = "/home/nejk/code/extreme_precip_exposure"

rerun = True  # Set to True to re-download data, False to skip existing files
create_sample_data = True  # Set to True to create sample data, False to skip
Setup of environment
import os
import zipfile
import cdsapi
import glob
from pathlib import Path
import xarray as xr
import numpy as np
import pandas as pd
import matplotlib.pyplot as plt
import geopandas as gpd
import cartopy.crs as ccrs
import cartopy.feature as cfeature
from functools import partial
from tqdm.auto import tqdm
import regionmask

# Set working directory (adjust as needed)
os.chdir(workdir)
print(f"Working directory: {os.getcwd()}")
Working directory: /etc/ecmwf/nfs/dh2_home_a/nejk/code/extreme_precip_exposure
# Define data directories
data_dir = Path("./data")
cds_dir = data_dir / "c3s_atlas"
hist_dir = cds_dir / "historical"
proj_dir = cds_dir / "projections"
output_dir = data_dir / admin_id / "extreme_precip_exposure"

# Create directories if they don't exist
for directory in [cds_dir, hist_dir, proj_dir, output_dir]:
    directory.mkdir(parents=True, exist_ok=True)

print(f"Data will be saved to: {cds_dir}")
print(f"Output files will be saved to: {output_dir}")
Data will be saved to: data/c3s_atlas
Output files will be saved to: data/ITF2/extreme_precip_exposure
Setup region specifics
regions_dir = data_dir / 'regions'
nuts_shp = regions_dir / 'NUTS_RG_20M_2024_4326' / 'NUTS_RG_20M_2024_4326.shp'
nuts_gdf = gpd.read_file(nuts_shp)

# Select the region of interest
sel_gdf = nuts_gdf[nuts_gdf['NUTS_ID'] == admin_id]
print(f"Region: {sel_gdf['NUTS_NAME'].values[0]}")
print(f"NUTS ID: {admin_id}")
print(f"Country: {sel_gdf['CNTR_CODE'].values[0]}")
print(f"Bounding box: {sel_gdf.geometry.total_bounds}")

# Rounded bounding box for downloading data (lon_min, lat_min, lon_max, lat_max)
lon_min, lat_min, lon_max, lat_max = sel_gdf.geometry.total_bounds
lon_min = (np.floor(lon_min) -1)
lat_min = (np.floor(lat_min) -1)
lon_max = (np.ceil(lon_max) +1)
lat_max = (np.ceil(lat_max) +1)
bbox = [lon_min, lat_min, lon_max, lat_max]
print(f"Rounded bounding box for data download: {bbox}")
Region: Molise
NUTS ID: ITF2
Country: IT
Bounding box: [13.94103834 41.38256335 15.13817868 42.07005936]
Rounded bounding box for data download: [np.float64(12.0), np.float64(40.0), np.float64(17.0), np.float64(44.0)]
Download Hazard Data
Helper function to unzip downloaded data
The CDS API downloads data as zip files. We need a function to extract and rename the NetCDF files.
def unzip_cds_data(zipfile_path):
    """
    Unzip data downloaded from CDS and rename to .nc extension.

    Parameters:
    -----------
    zipfile_path : Path or str
        Path to the zip file to extract
    """
    zipfile_path = Path(zipfile_path)

    with zipfile.ZipFile(zipfile_path, 'r') as zip_ref:
        names = zip_ref.namelist()
        zip_ref.extractall(zipfile_path.parent)

        for name in names:
            if name.split(".")[-1] == "nc":
                # Rename the extracted file to match the zip filename
                nc_path = zipfile_path.with_suffix('.nc')
                os.rename(zipfile_path.parent / name, nc_path)
                print(f"  Extracted: {nc_path.name}")
            else:
                # Remove non-NetCDF files
                os.remove(zipfile_path.parent / name)

    # Remove the zip file after extraction
    os.remove(zipfile_path)
    print(f"  Removed: {zipfile_path.name}")
Download historical climate model outputs
We’ll download historical climate outputs (1970-2005); takes only 1–2 minutes.
# Download historical climate model outputs
print("Downloading historical data (1970-2005)...")
print("=" * 60)

# Create filename
hist_zipfile = hist_dir / f"daily_precip_monmax_1970_2005_{admin_id}.zip"
hist_ncfile = hist_zipfile.with_suffix('.nc')

if not rerun and hist_ncfile.exists():
    print(f"  File already exists, skipping: {hist_ncfile.name}")
else:
    dataset = "multi-origin-c3s-atlas"
    request = {
        "variable": ["monthly_maximum_1_day_precipitation"],
        "origin": "cordex_eur_11",
        "domain": "euro_cordex",
        "experiment": "historical",
        "bias_adjustment": "no_bias_adjustment",
        "period": "1970-2005",
        "area": [lat_max, lon_min, lat_min, lon_max], # N, W, S, E
    }
    try:
        client = cdsapi.Client()
        client.retrieve(dataset, request).download(str(hist_zipfile))
        unzip_cds_data(hist_zipfile)
        proj_files.append(hist_ncfile)
    except Exception as e:
        print(f"  Error downloading historical data: {e}")
Downloading historical data (1970-2005)...
============================================================
  File already exists, skipping: daily_precip_monmax_1970_2005_ITF2.nc
Download projected climate model outputs
We’ll download all available models for all RCPs available; takes about 5-6 minutes. You can adjust these lists based on your needs.
# Define projection scenarios to download
rcps = ["rcp_2_6","rcp_4_5", "rcp_8_5"]
# Download projection data
print("Downloading projection data (2006-2100)...")
print("=" * 60)
proj_files = []
download_count = 0
skip_count = 0
error_count = 0
for rcp in rcps:
# Create filename
proj_zipfile = proj_dir / f"daily_precip_monmax_{rcp}_2006_2100_{admin_id}.zip"
proj_ncfile = proj_zipfile.with_suffix('.nc')
# Skip if already downloaded
if not rerun and proj_ncfile.exists():
skip_count += 1
proj_files.append(proj_ncfile)
continue
dataset = "multi-origin-c3s-atlas"
request = {
"variable": ["monthly_maximum_1_day_precipitation"],
"origin": "cordex_eur_11",
"experiment": rcp,
"bias_adjustment": "no_bias_adjustment",
"period": "2006-2100",
"area": [lat_max, lon_min, lat_min, lon_max], # N, W, S, E
}
try:
client = cdsapi.Client()
client.retrieve(dataset, request).download(str(proj_zipfile))
unzip_cds_data(proj_zipfile)
proj_files.append(proj_ncfile)
download_count += 1
except Exception as e:
error_count += 1
print(f" Error downloading projection data: {e}")
print("=" * 60)
print(f"Projection data download summary:")
print(f" New downloads: {download_count}")
print(f" Already existed: {skip_count}")
print(f" Errors/unavailable: {error_count}")
print(f" Total projection files: {len(proj_files)}")Downloading projection data (2006-2100)...
============================================================
============================================================
Projection data download summary:
New downloads: 0
Already existed: 3
Errors/unavailable: 0
Total projection files: 3
Process Hazard Data
Create NUTS region mask
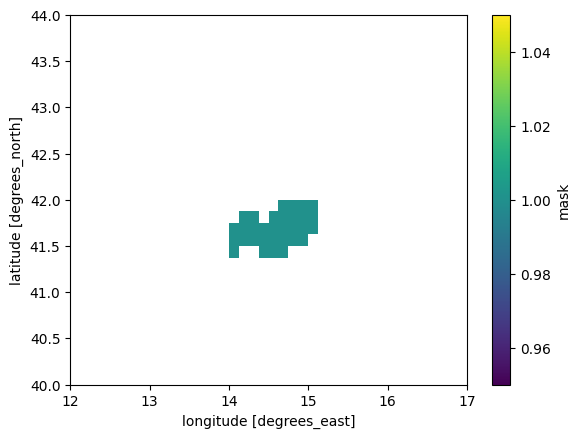
# Use regionmask to create a 2D mask for the NUTS region from sel_gdf geometry and with grid from the historical dataset
nuts_mask = regionmask.mask_geopandas(sel_gdf, xr.open_dataset(hist_dir / f"daily_precip_monmax_1970_2005_{admin_id}.nc"))
# reset index to np.nan/1
nuts_mask = xr.where(nuts_mask >= 1, 1, np.nan)
nuts_mask.plot()

# Number of grid points in the mask:
print(f"\nNumber of grid points in the mask: {np.sum(~np.isnan(nuts_mask.values))}")
/usr/local/apps/python3/3.12.11-01/lib/python3.12/site-packages/gribapi/__init__.py:23: UserWarning: ecCodes 2.42.0 or higher is recommended. You are running version 2.31.0
warnings.warn(
Number of grid points in the mask: 32
Process historical data
Now we’ll read the historical data and extract information for our NUTS region. We’ll save all grid point values as a csv for later processing, but also extract only the maximum per model and time step for a quick look.
Read and extract model information
# Read historical NetCDF file
hist_ncfile = hist_dir / f"daily_precip_monmax_1970_2005_{admin_id}.nc"

if hist_ncfile.exists():
    # Open historical data
    precip_hist = xr.open_dataset(hist_ncfile)
    print("\nHistorical dataset:")
    print(precip_hist)

    # print all multi model ensemble members by gcm_model and rcm_model and ensemble member combinations and associate with member_id
    mm_ensemble = precip_hist.groupby("member_id").groups.keys()
    print("\nMulti-model ensemble member:")
    i = 0
    for combo in mm_ensemble:
        print(combo) #  the member_id is defined as {gcm_institution}_{gcm_model}_{gcm_variant}_{rcm_institution}_{rcm_model}_{rcm_variant}
        #print(f"{precip_hist['gcm_institution'].values[i]}_{precip_hist['gcm_model'].values[i]}_{precip_hist['gcm_variant'].values[i]}_{precip_hist['rcm_institution'].values[i]}_{precip_hist['rcm_model'].values[i]}_{precip_hist['rcm_variant'].values[i]}")
        i += 1
else:
    print("Historical data file not found. Please download the data first.")

n_mmens = len(mm_ensemble)
print(f"\n {"-"*80} \n   * {n_mmens} multi-model ensemble members found in the historical dataset. \n {"-"*80} \n")
Historical dataset:
<xarray.Dataset> Size: 157MB
Dimensions:          (lat: 32, bnds: 2, lon: 40, time: 432, member: 71)
Coordinates:
  * lat              (lat) float64 256B 40.06 40.19 40.31 ... 43.69 43.81 43.94
  * lon              (lon) float64 320B 12.06 12.19 12.31 ... 16.69 16.81 16.94
  * time             (time) datetime64[ns] 3kB 1970-01-01 ... 2005-12-01
    member_id        (member) <U60 17kB ...
    gcm_institution  (member) <U12 3kB ...
    gcm_model        (member) <U12 3kB ...
    gcm_variant      (member) <U7 2kB ...
    rcm_institution  (member) <U10 3kB ...
    rcm_model        (member) <U17 5kB ...
    rcm_variant      (member) <U3 852B ...
Dimensions without coordinates: bnds, member
Data variables:
    lat_bnds         (lat, bnds) float64 512B ...
    lon_bnds         (lon, bnds) float64 640B ...
    time_bnds        (time, bnds) datetime64[ns] 7kB ...
    rx1day           (member, time, lat, lon) float32 157MB ...
    crs              int32 4B ...
Attributes: (12/27)
    Conventions:                CF-1.9 ACDD-1.3
    title:                      Copernicus Interactive Climate Atlas: gridded...
    summary:                    Monthly/annual gridded data from observations...
    institution:                Copernicus Climate Change Service (C3S)
    producers:                  Institute of Physics of Cantabria (IFCA, CSIC...
    license:                    CC-BY 4.0, https://creativecommons.org/licens...
    ...                         ...
    geospatial_lon_max:         65.25
    geospatial_lon_resolution:  0.125
    geospatial_lon_units:       degrees_east
    date_created:               2024-12-09 16:29:21.663954+01:00
    tracking_id:                73658aed-c6cb-4b63-bfdf-027e0e38d927
    project_id:                 c3s-cica-atlas

Multi-model ensemble member:
CCCma_CanESM2_r1i1p1_CLMcom_CCLM4-8-17_v1
CCCma_CanESM2_r1i1p1_GERICS_REMO2015_v1
CNRM-CERFACS_CNRM-CM5_r1i1p1_CLMcom-ETH_COSMO-crCLIM-v1-1_v1
CNRM-CERFACS_CNRM-CM5_r1i1p1_CLMcom_CCLM4-8-17_v1
CNRM-CERFACS_CNRM-CM5_r1i1p1_CNRM_ALADIN63_v2
CNRM-CERFACS_CNRM-CM5_r1i1p1_DMI_HIRHAM5_v2
CNRM-CERFACS_CNRM-CM5_r1i1p1_GERICS_REMO2015_v2
CNRM-CERFACS_CNRM-CM5_r1i1p1_ICTP_RegCM4-6_v1
CNRM-CERFACS_CNRM-CM5_r1i1p1_IPSL_WRF381P_v2
CNRM-CERFACS_CNRM-CM5_r1i1p1_KNMI_RACMO22E_v2
CNRM-CERFACS_CNRM-CM5_r1i1p1_MOHC_HadREM3-GA7-05_v2
CNRM-CERFACS_CNRM-CM5_r1i1p1_SMHI_RCA4_v1
ICHEC_EC-EARTH_r12i1p1_CLMcom-ETH_COSMO-crCLIM-v1-1_v1
ICHEC_EC-EARTH_r12i1p1_CLMcom_CCLM4-8-17_v1
ICHEC_EC-EARTH_r12i1p1_DMI_HIRHAM5_v1
ICHEC_EC-EARTH_r12i1p1_GERICS_REMO2015_v1
ICHEC_EC-EARTH_r12i1p1_ICTP_RegCM4-6_v1
ICHEC_EC-EARTH_r12i1p1_IPSL_WRF381P_v1
ICHEC_EC-EARTH_r12i1p1_KNMI_RACMO22E_v1
ICHEC_EC-EARTH_r12i1p1_MOHC_HadREM3-GA7-05_v1
ICHEC_EC-EARTH_r12i1p1_SMHI_RCA4_v1
ICHEC_EC-EARTH_r12i1p1_UHOH_WRF361H_v1
ICHEC_EC-EARTH_r1i1p1_CLMcom-ETH_COSMO-crCLIM-v1-1_v1
ICHEC_EC-EARTH_r1i1p1_DMI_HIRHAM5_v1
ICHEC_EC-EARTH_r1i1p1_KNMI_RACMO22E_v1
ICHEC_EC-EARTH_r1i1p1_SMHI_RCA4_v1
ICHEC_EC-EARTH_r3i1p1_CLMcom-ETH_COSMO-crCLIM-v1-1_v1
ICHEC_EC-EARTH_r3i1p1_DMI_HIRHAM5_v2
ICHEC_EC-EARTH_r3i1p1_KNMI_RACMO22E_v1
ICHEC_EC-EARTH_r3i1p1_SMHI_RCA4_v1
IPSL_IPSL-CM5A-MR_r1i1p1_DMI_HIRHAM5_v1
IPSL_IPSL-CM5A-MR_r1i1p1_GERICS_REMO2015_v1
IPSL_IPSL-CM5A-MR_r1i1p1_IPSL_WRF381P_v1
IPSL_IPSL-CM5A-MR_r1i1p1_KNMI_RACMO22E_v1
IPSL_IPSL-CM5A-MR_r1i1p1_SMHI_RCA4_v1
MIROC_MIROC5_r1i1p1_CLMcom_CCLM4-8-17_v1
MIROC_MIROC5_r1i1p1_GERICS_REMO2015_v1
MOHC_HadGEM2-ES_r1i1p1_CLMcom_CCLM4-8-17_v1
MOHC_HadGEM2-ES_r1i1p1_CNRM_ALADIN63_v1
MOHC_HadGEM2-ES_r1i1p1_DMI_HIRHAM5_v2
MOHC_HadGEM2-ES_r1i1p1_GERICS_REMO2015_v1
MOHC_HadGEM2-ES_r1i1p1_ICTP_RegCM4-6_v1
MOHC_HadGEM2-ES_r1i1p1_IPSL_WRF381P_v1
MOHC_HadGEM2-ES_r1i1p1_KNMI_RACMO22E_v2
MOHC_HadGEM2-ES_r1i1p1_MOHC_HadREM3-GA7-05_v1
MOHC_HadGEM2-ES_r1i1p1_SMHI_RCA4_v1
MOHC_HadGEM2-ES_r1i1p1_UHOH_WRF361H_v1
MPI-M_MPI-ESM-LR_r1i1p1_CLMcom-ETH_COSMO-crCLIM-v1-1_v1
MPI-M_MPI-ESM-LR_r1i1p1_CLMcom_CCLM4-8-17_v1
MPI-M_MPI-ESM-LR_r1i1p1_CNRM_ALADIN63_v1
MPI-M_MPI-ESM-LR_r1i1p1_DMI_HIRHAM5_v1
MPI-M_MPI-ESM-LR_r1i1p1_ICTP_RegCM4-6_v1
MPI-M_MPI-ESM-LR_r1i1p1_KNMI_RACMO22E_v1
MPI-M_MPI-ESM-LR_r1i1p1_MOHC_HadREM3-GA7-05_v1
MPI-M_MPI-ESM-LR_r1i1p1_MPI-CSC_REMO2009_v1
MPI-M_MPI-ESM-LR_r1i1p1_SMHI_RCA4_v1a
MPI-M_MPI-ESM-LR_r1i1p1_UHOH_WRF361H_v1
MPI-M_MPI-ESM-LR_r2i1p1_CLMcom-ETH_COSMO-crCLIM-v1-1_v1
MPI-M_MPI-ESM-LR_r2i1p1_MPI-CSC_REMO2009_v1
MPI-M_MPI-ESM-LR_r2i1p1_SMHI_RCA4_v1
MPI-M_MPI-ESM-LR_r3i1p1_CLMcom-ETH_COSMO-crCLIM-v1-1_v1
MPI-M_MPI-ESM-LR_r3i1p1_GERICS_REMO2015_v1
MPI-M_MPI-ESM-LR_r3i1p1_SMHI_RCA4_v1
NCC_NorESM1-M_r1i1p1_CLMcom-ETH_COSMO-crCLIM-v1-1_v1
NCC_NorESM1-M_r1i1p1_CNRM_ALADIN63_v1
NCC_NorESM1-M_r1i1p1_DMI_HIRHAM5_v3
NCC_NorESM1-M_r1i1p1_GERICS_REMO2015_v1
NCC_NorESM1-M_r1i1p1_ICTP_RegCM4-6_v1
NCC_NorESM1-M_r1i1p1_IPSL_WRF381P_v1
NCC_NorESM1-M_r1i1p1_MOHC_HadREM3-GA7-05_v1
NCC_NorESM1-M_r1i1p1_SMHI_RCA4_v1

 --------------------------------------------------------------------------------
   * 71 multi-model ensemble members found in the historical dataset.
 --------------------------------------------------------------------------------
Mask using NUTS region
# Extract data for NUTS region using regionmask
precip_hist_nuts = precip_hist.where(nuts_mask == 1, drop=True)
print(f"\nData for {admin_id}:")
print(precip_hist_nuts)

#precip_hist_nuts.isel(time=0).isel(member=0)['rx1day'].plot()
#precip_hist_nuts.isel(member=0)['rx1day'].max(dim=['lon','lat']).plot()
Data for ITF2:
<xarray.Dataset> Size: 6MB
Dimensions:          (lat: 5, bnds: 2, lon: 9, time: 432, member: 71)
Coordinates:
  * lat              (lat) float64 40B 41.44 41.56 41.69 41.81 41.94
  * lon              (lon) float64 72B 14.06 14.19 14.31 ... 14.81 14.94 15.06
  * time             (time) datetime64[ns] 3kB 1970-01-01 ... 2005-12-01
    member_id        (member) <U60 17kB 'CCCma_CanESM2_r1i1p1_CLMcom_CCLM4-8-...
    gcm_institution  (member) <U12 3kB ...
    gcm_model        (member) <U12 3kB ...
    gcm_variant      (member) <U7 2kB ...
    rcm_institution  (member) <U10 3kB ...
    rcm_model        (member) <U17 5kB ...
    rcm_variant      (member) <U3 852B ...
Dimensions without coordinates: bnds, member
Data variables:
    lat_bnds         (lat, bnds, lon) float64 720B 41.38 nan nan ... 42.0 42.0
    lon_bnds         (lon, bnds, lat) float64 720B 14.0 14.0 ... 15.12 15.12
    time_bnds        (time, bnds, lat, lon) datetime64[ns] 311kB 1970-01-01 ....
    rx1day           (member, time, lat, lon) float32 6MB 23.95 nan ... 7.825
    crs              (lat, lon) float64 360B -2.147e+09 nan ... -2.147e+09
Attributes: (12/27)
    Conventions:                CF-1.9 ACDD-1.3
    title:                      Copernicus Interactive Climate Atlas: gridded...
    summary:                    Monthly/annual gridded data from observations...
    institution:                Copernicus Climate Change Service (C3S)
    producers:                  Institute of Physics of Cantabria (IFCA, CSIC...
    license:                    CC-BY 4.0, https://creativecommons.org/licens...
    ...                         ...
    geospatial_lon_max:         65.25
    geospatial_lon_resolution:  0.125
    geospatial_lon_units:       degrees_east
    date_created:               2024-12-09 16:29:21.663954+01:00
    tracking_id:                73658aed-c6cb-4b63-bfdf-027e0e38d927
    project_id:                 c3s-cica-atlas
Save all data as csv
# File 1: all data
# - convert xarray dataset precip_hist_nuts to a pandas dataframe
# - cleanup to save storage space and make it easier to work with for further analysis
# - save all lon/lat points in the NUTS region to a csv file with columns for time (format: YYYY-MM), member/member_id (but also rcm and gcm details, i.e. gcm_institution, gcm_model, gcm_variant, rcm_institution, rcm_model, rcm_variant), lon, lat, and rx1day
precip_hist_nuts_df = precip_hist_nuts.to_dataframe().reset_index()
precip_hist_nuts_df['time'] = precip_hist_nuts_df['time'].dt.strftime('%Y-%m')
precip_hist_nuts_df.drop(columns=['lon_bnds', 'lat_bnds', 'bnds', 'time_bnds', 'crs'], inplace=True) # remove some unnecessary columns
precip_hist_nuts_df.dropna(inplace=True) # drop all rows with missing values (i.e. points outside the NUTS region)
precip_hist_nuts_df['admin_id'] = admin_id
precip_hist_nuts_df.to_csv(f"{output_dir}/{admin_id}_precip_hist_all_points.csv", index=False)
print(f"Written file: {output_dir}/{admin_id}_precip_hist_all_points.csv")
Written file: data/ITF2/extreme_precip_exposure/ITF2_precip_hist_all_points.csv
Save annual max for all points and models as csv
# File 2: annual maximum and NUTS maximum of rx1day for each time step and member/member_id
precip_hist_nuts_amax = precip_hist_nuts.groupby('time.year').max()
precip_hist_nuts_amax_df = precip_hist_nuts_amax.to_dataframe().reset_index()
precip_hist_nuts_amax_df.drop(columns=['lon_bnds', 'lat_bnds', 'bnds', 'time_bnds', 'crs'], inplace=True) # remove some unnecessary columns
precip_hist_nuts_amax_df['admin_id'] = admin_id
precip_hist_nuts_amax_df.to_csv(f"{output_dir}/{admin_id}_precip_hist_amax_all_points.csv", index=False)
print(f"Written file: {output_dir}/{admin_id}_precip_hist_amax_all_points.csv")
Written file: data/ITF2/extreme_precip_exposure/ITF2_precip_hist_amax_all_points.csv
Save sample data for tutorials
if create_sample_data:

    # Sample grid point; the one closest to the centroid of the NUTS region:
    nuts_centroid = (
        sel_gdf.to_crs(epsg=3035)   # projected CRS for accurate centroid
        .geometry.centroid
        .to_crs(sel_gdf.crs)        # back to original CRS (lon/lat)
        .values[0]
    )
    lon = precip_hist_nuts['lon'].values
    lat = precip_hist_nuts['lat'].values
    lon_idx = np.argmin(np.abs(lon - nuts_centroid.x))
    lat_idx = np.argmin(np.abs(lat - nuts_centroid.y))

    # Save monthly data for one member and one grid point (the one closest to the centroid of the NUTS region)
    imember = 0
    precip_hist_nuts_df[(precip_hist_nuts_df['member'] == imember) & (precip_hist_nuts_df['lon'] == lon[lon_idx]) & (precip_hist_nuts_df['lat'] == lat[lat_idx])].to_csv(f"{output_dir}/{admin_id}_precip_hist_sample_model_gridpoint.csv", index=False)
    print(f"Written file: {output_dir}/{admin_id}_precip_hist_sample_model_gridpoint.csv")

    # Save just annual max of one member but for all grid points in NUTS region
    imember = 0
    precip_hist_nuts_amax_df[precip_hist_nuts_amax_df['member'] == imember].to_csv(f"{output_dir}/{admin_id}_precip_hist_amax_sample_model.csv", index=False)
    print(f"Written file: {output_dir}/{admin_id}_precip_hist_amax_sample_model.csv")

    # Save just annual max one grid point (the one closest to the centroid of the NUTS region) but for all models
    precip_hist_nuts_amax_df[(precip_hist_nuts_amax_df['lon'] == lon[lon_idx]) & (precip_hist_nuts_amax_df['lat'] == lat[lat_idx])].to_csv(f"{output_dir}/{admin_id}_precip_hist_amax_sample_gridpoint.csv", index=False)
    print(f"Written file: {output_dir}/{admin_id}_precip_hist_amax_sample_gridpoint.csv")
Written file: data/ITF2/extreme_precip_exposure/ITF2_precip_hist_sample_model_gridpoint.csv
Written file: data/ITF2/extreme_precip_exposure/ITF2_precip_hist_amax_sample_model.csv
Written file: data/ITF2/extreme_precip_exposure/ITF2_precip_hist_amax_sample_gridpoint.csv
Process projection data
We’ll read all projection files and organize them by RCPs; again save all grid point values and extract only the maximum per model and time step.
Read data
# Load projection data for each RCP
projection_data = {}

for rcp in rcps:
    proj_ncfile = proj_dir / f"daily_precip_monmax_{rcp}_2006_2100_{admin_id}.nc"

    if proj_ncfile.exists():
        try:
            # Load dataset
            ds = xr.open_dataset(proj_ncfile)
            projection_data[rcp] = ds
        except Exception as e:
            print(f"Error loading {proj_ncfile}: {e}")

print(f"\nSuccessfully loaded {len(projection_data)} model combinations")

# Show example
if len(projection_data) > 0:
    example_key = list(projection_data.keys())[0]
    print(f"\nExample dataset ({example_key}):")
    print(projection_data[example_key])
Successfully loaded 3 model combinations

Example dataset (rcp_2_6):
<xarray.Dataset> Size: 140MB
Dimensions:          (lat: 32, bnds: 2, lon: 40, time: 1140, member: 24)
Coordinates:
  * lat              (lat) float64 256B 40.06 40.19 40.31 ... 43.69 43.81 43.94
  * lon              (lon) float64 320B 12.06 12.19 12.31 ... 16.69 16.81 16.94
  * time             (time) datetime64[ns] 9kB 2006-01-01 ... 2100-12-01
    member_id        (member) <U45 4kB ...
    gcm_institution  (member) <U12 1kB ...
    gcm_model        (member) <U10 960B ...
    gcm_variant      (member) <U7 672B ...
    rcm_institution  (member) <U7 672B ...
    rcm_model        (member) <U14 1kB ...
    rcm_variant      (member) <U3 288B ...
Dimensions without coordinates: bnds, member
Data variables:
    lat_bnds         (lat, bnds) float64 512B ...
    lon_bnds         (lon, bnds) float64 640B ...
    time_bnds        (time, bnds) datetime64[ns] 18kB ...
    rx1day           (member, time, lat, lon) float32 140MB ...
    crs              int32 4B ...
Attributes: (12/27)
    Conventions:                CF-1.9 ACDD-1.3
    title:                      Copernicus Interactive Climate Atlas: gridded...
    summary:                    Monthly/annual gridded data from observations...
    institution:                Copernicus Climate Change Service (C3S)
    producers:                  Institute of Physics of Cantabria (IFCA, CSIC...
    license:                    CC-BY 4.0, https://creativecommons.org/licens...
    ...                         ...
    geospatial_lon_max:         65.25
    geospatial_lon_resolution:  0.125
    geospatial_lon_units:       degrees_east
    date_created:               2024-12-09 16:29:21.663954+01:00
    tracking_id:                adf90d60-f323-41b2-8ddd-b50a6da15e5f
    project_id:                 c3s-cica-atlas
Mask using NUTS region
precip_proj_nuts = {}

for rcp in rcps:
    precip_proj_nuts[rcp] = projection_data[rcp].where(nuts_mask == 1, drop=True)
Save all data as csv
# - convert xarray dataset precip_proj_nuts to a pandas dataframe, but include all rcp scenario as a column in the dataframe
# - cleanup to save storage space and make it easier to work with for further analysis
# - save all lon/lat points in the NUTS region to a csv file with columns for time (format: YYYY-MM), member/member_id (but also rcm and gcm details, i.e. gcm_institution, gcm_model, gcm_variant, rcm_institution, rcm_model, rcm_variant), lon, lat, and rx1day
precip_proj_nuts_df = pd.DataFrame()
for rcp in rcps:
    dummy = precip_proj_nuts[rcp].to_dataframe().reset_index()
    dummy['rcp'] = rcp
    precip_proj_nuts_df = pd.concat([precip_proj_nuts_df, dummy], ignore_index=True)
precip_proj_nuts_df['time'] = precip_proj_nuts_df['time'].dt.strftime('%Y-%m')
precip_proj_nuts_df.drop(columns=['lon_bnds', 'lat_bnds', 'bnds', 'time_bnds', 'crs'], inplace=True) # remove some unnecessary columns
precip_proj_nuts_df.dropna(inplace=True) # drop all rows with missing values (i.e. points outside the NUTS region)
precip_proj_nuts_df['admin_id'] = admin_id
precip_proj_nuts_df.to_csv(f"{output_dir}/{admin_id}_precip_proj_all_points.csv", index=False)
print(f"Written file: {output_dir}/{admin_id}_precip_proj_all_points.csv")
Written file: data/ITF2/extreme_precip_exposure/ITF2_precip_proj_all_points.csv
Save annual max as csv
# File 2: annual maximum
precip_proj_nuts_amax_df = pd.DataFrame()
for rcp in rcps:
    dummy = precip_proj_nuts[rcp].groupby('time.year').max().to_dataframe().reset_index()
    dummy['rcp'] = rcp
    precip_proj_nuts_amax_df = pd.concat([precip_proj_nuts_amax_df, dummy], ignore_index=True)
precip_proj_nuts_amax_df.drop(columns=['lon_bnds', 'lat_bnds', 'bnds', 'time_bnds', 'crs'], inplace=True) # remove some unnecessary columns
precip_proj_nuts_amax_df['admin_id'] = admin_id
precip_proj_nuts_amax_df.to_csv(f"{output_dir}/{admin_id}_precip_proj_amax_all_points.csv", index=False)
print(f"Written file: {output_dir}/{admin_id}_precip_proj_amax_all_points.csv")
Written file: data/ITF2/extreme_precip_exposure/ITF2_precip_proj_amax_all_points.csv
Save sample data for tutorials
if create_sample_data:

    # Sample grid point; the one closest to the centroid of the NUTS region:
    nuts_centroid = (
        sel_gdf.to_crs(epsg=3035)   # projected CRS for accurate centroid
        .geometry.centroid
        .to_crs(sel_gdf.crs)        # back to original CRS (lon/lat)
        .values[0]
    )
    lon = precip_proj_nuts[rcps[0]]['lon'].values
    lat = precip_proj_nuts[rcps[0]]['lat'].values
    lon_idx = np.argmin(np.abs(lon - nuts_centroid.x))
    lat_idx = np.argmin(np.abs(lat - nuts_centroid.y))

    # Save monthly data for one member and one grid point (the one closest to the centroid of the NUTS region)
    imember = 0
    precip_proj_nuts_df[(precip_proj_nuts_df['member'] == imember) & (precip_proj_nuts_df['lon'] == lon[lon_idx]) & (precip_proj_nuts_df['lat'] == lat[lat_idx])].to_csv(f"{output_dir}/{admin_id}_precip_proj_sample_model_gridpoint.csv", index=False)
    print(f"Written file: {output_dir}/{admin_id}_precip_proj_sample_model_gridpoint.csv")

    # Save just annual max of one member but for all grid points in NUTS region
    imember = 0
    precip_proj_nuts_amax_df[precip_proj_nuts_amax_df['member'] == imember].to_csv(f"{output_dir}/{admin_id}_precip_proj_amax_sample_model.csv", index=False)
    print(f"Written file: {output_dir}/{admin_id}_precip_proj_amax_sample_model.csv")

    # Save just annual max one grid point (the one closest to the centroid of the NUTS region) but for all models
    precip_proj_nuts_amax_df[(precip_proj_nuts_amax_df['lon'] == lon[lon_idx]) & (precip_proj_nuts_amax_df['lat'] == lat[lat_idx])].to_csv(f"{output_dir}/{admin_id}_precip_proj_amax_sample_gridpoint.csv", index=False)
    print(f"Written file: {output_dir}/{admin_id}_precip_proj_amax_sample_gridpoint.csv")
Written file: data/ITF2/extreme_precip_exposure/ITF2_precip_proj_sample_model_gridpoint.csv
Written file: data/ITF2/extreme_precip_exposure/ITF2_precip_proj_amax_sample_model.csv
Written file: data/ITF2/extreme_precip_exposure/ITF2_precip_proj_amax_sample_gridpoint.csv
Output summary
Output files created:
{admin_id}_precip_hist_all_points.csv- Historical model outputs with monthly maximum of daily precipitation for all grid points within NUTS region with admin_id (1970-2005){admin_id}_precip_hist_amax.csv- Historical model outputs with annual maximum of daily precipitation for all grid points within NUTS region with admin_id (1970-2005){admin_id}_precip_proj_all_points.csv- Projected model outputs with monthly maximum of daily precipitation for all grid points within NUTS region with admin_id (2006-2100){admin_id}_precip_proj_amax.csv- Projected model outputs with annual maximum of daily precipitation for all grid points within NUTS region with admin_id (2006-2100) These CSV files can now be used for further analysis, risk assessment, or integration with exposure and vulnerability data.
In addition, we created the following sample data (if create_sample_data is set to true) that is used in the return period tutorial:
{admin_id}_precip_hist_sample_model.csv- Historical model output for one model/simulation for all grid points within NUTS region with admin_id (1970-2005){admin_id}_precip_hist_amax_sample_model.csv- Historical model outputs for one model/simulation with annual maximum of daily precipitation for all grid points within NUTS region with admin_id (1970-2005){admin_id}_precip_hist_amax_sample_gridpoint.csv- Historical model outputs for all model/simulation with annual maximum of daily precipitation for the closest gridpoint to centre of of the NUTS region with admin_id (1970-2005){admin_id}_precip_proj_sample_model.csv- Projected model output for one model/simulation for all grid points within NUTS region with admin_id (2006-2100){admin_id}_precip_proj_amax_sample_model.csv- Projected model outputs for one model/simulation with annual maximum of daily precipitation for all grid points within NUTS region with admin_id (2006-2100){admin_id}_precip_proj_amax_sample_gridpoint.csv- Projected model outputs for all model/simulation with annual maximum of daily precipitation for the closest gridpoint to centre of of the NUTS region with admin_id (2006-2100)
If you want to continue now, why don’t you move on to the return period tutorial?